The Axial Seamount, an underwater volcano about 470 kilometres off the
Oregon coast, is one of the world's most active volcanoes and one of
the most intensively studied.
Three research papers published last week
describe a large eruption at Axial Seamount that took place in April
2015. At the recent meeting of the American Geophysical Union,
researchers from the Monterey Bay Aquarium Research Institute (MBARI)
presented a new seafloor map that complemented these research papers,
showing the results of detailed underwater surveys conducted in August
2016. This map reveals a number of previously undocumented flows from
the 2015 eruption.
By comparing the new map with survey data before the eruption,
researchers were able to estimate the volume of lava that was emitted.
The new data indicates that the eruption consisted of 14 separate
lava flows containing almost 156 million cubic metres of lava.
Using the new map, geologists were able to identify where the lava had
been disgorged from the seafloor.
During the 2015 eruption, there had
been a series of “eruptive fissures” that extended 19 kilometres from
the north end of the Axial crater (caldera) and far up the north rift
zone.
In addition to the lava that erupted in 2015, the new map also covers
the entire Axial caldera, and the north and south rift zones. As such,
it can serve as a useful benchmark for geologists the next time the
volcano erupts.
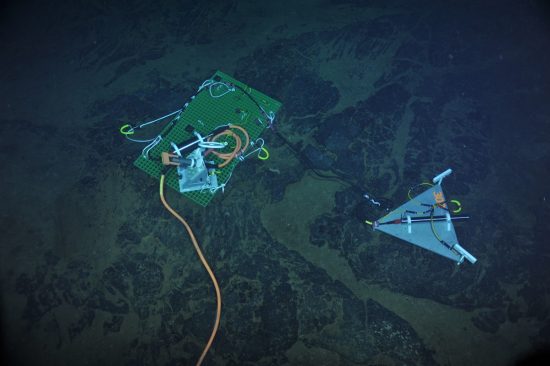
The researchers also combined data from a seafloor mapping autonomous
underwater vehicle (AUV) from MBARI and another AUV from Woods Hole
Oceanographic Institution. Because they move 50 to 75 metres above the
seafloor, they can reveal details like thin lava flows that are
invisible to sonar from surface ships.
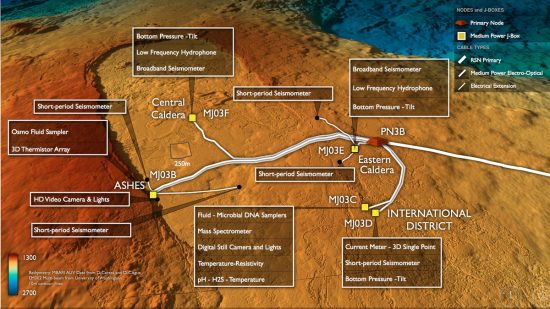
Although seafloor pressure recorders like those deployed on the Ocean
Observatories Initiative (OOI) Cabled Array at Axial Seamount can
record very small changes in seafloor depth (deformation), they only
provide point measurements.
MBARI researchers had to run identical sets
of AUV survey lines across the entire caldera in 2011, 2014, 2015 and
2016 to show deformation over a larger area.
These surveys showed that the caldera's centre bulged up as much 1.8
metres between 2011 and 2014 (after the 2011 eruption), then subsided
more than one metre between 2014 and 2015 (during the 2015 eruption).
Between 2015 and 2016, the caldera floor uplifted about half a metre,
suggesting that magma has been building up below the caldera prior to
the next eruption.
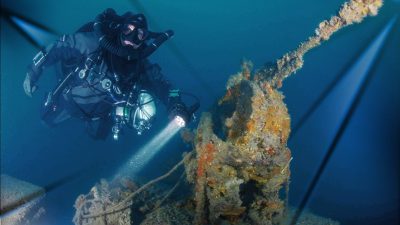
Besides the AUV surveys, MBARI researchers have also conducted about 40
dives on Axial Seamount using remotely operated vehicles (ROVs) over
the past ten years.
Their latest dives in 2016 revealed fascinating
details about the 2015 flow. For instance, on one fresh lava flow, the
researchers discovered a field of hydrothermal chimneys (30- to
50-centimeter-tall) complete with tubeworms and other vent animals.
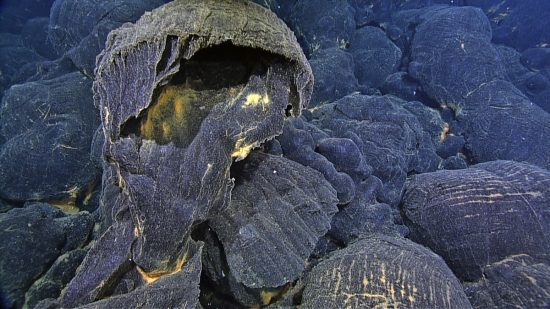
The 2016 ROV dives also revealed hundreds of lava “pillows” that
exploded during the 2015 eruption, in parts of the new flows not
explored in 2015 during the ROV Jason dives. Tens of thousands of
gunshot-like sounds had been documented by the seafloor seismometers on
the OOI Cabled Array. Geologists suspect that they were produced when
seawater became trapped beneath fingers of hot lava, then suddenly
turned to steam, and exploded.
Much larger explosions had taken place in the Axial Seamount's early
history, according to research by former MBARI postdoctoral fellow Ryan
Portner. These explosions scattered much pulverised lava over wide
areas of the seafloor.
Portner analysed layers of fine-grained sediment
on the rims of the summit caldera, and used the shells of foraminifera
(tiny marine animals) to measure how long ago these sediment layers
were deposited. His research suggests that the main caldera at Axial
Seamount had formed between 700 and 1,200 years ago.
The Axial Volcano had erupted in 1998, 2011 and 2015, as well as dozens
of times in the preceding 350 years; the next eruption is likely to
occur within the next decade. When that happens, MBARI’s new
bathymetric map will provide essential information for geologists
trying to figure out the extent and volume of the latest flow from this
amazingly active underwater volcano.
 Mares
Mares 29th December 2016